Canvas Visualizations
Canvas Visualizations
Basic Memory can create visual knowledge maps using Obsidian's Canvas feature. These visualizations help you understand relationships between concepts, map out processes, and visualize your knowledge structure.
Creating Canvas Visualizations
Ask Claude to create a visualization by describing what you want to map:
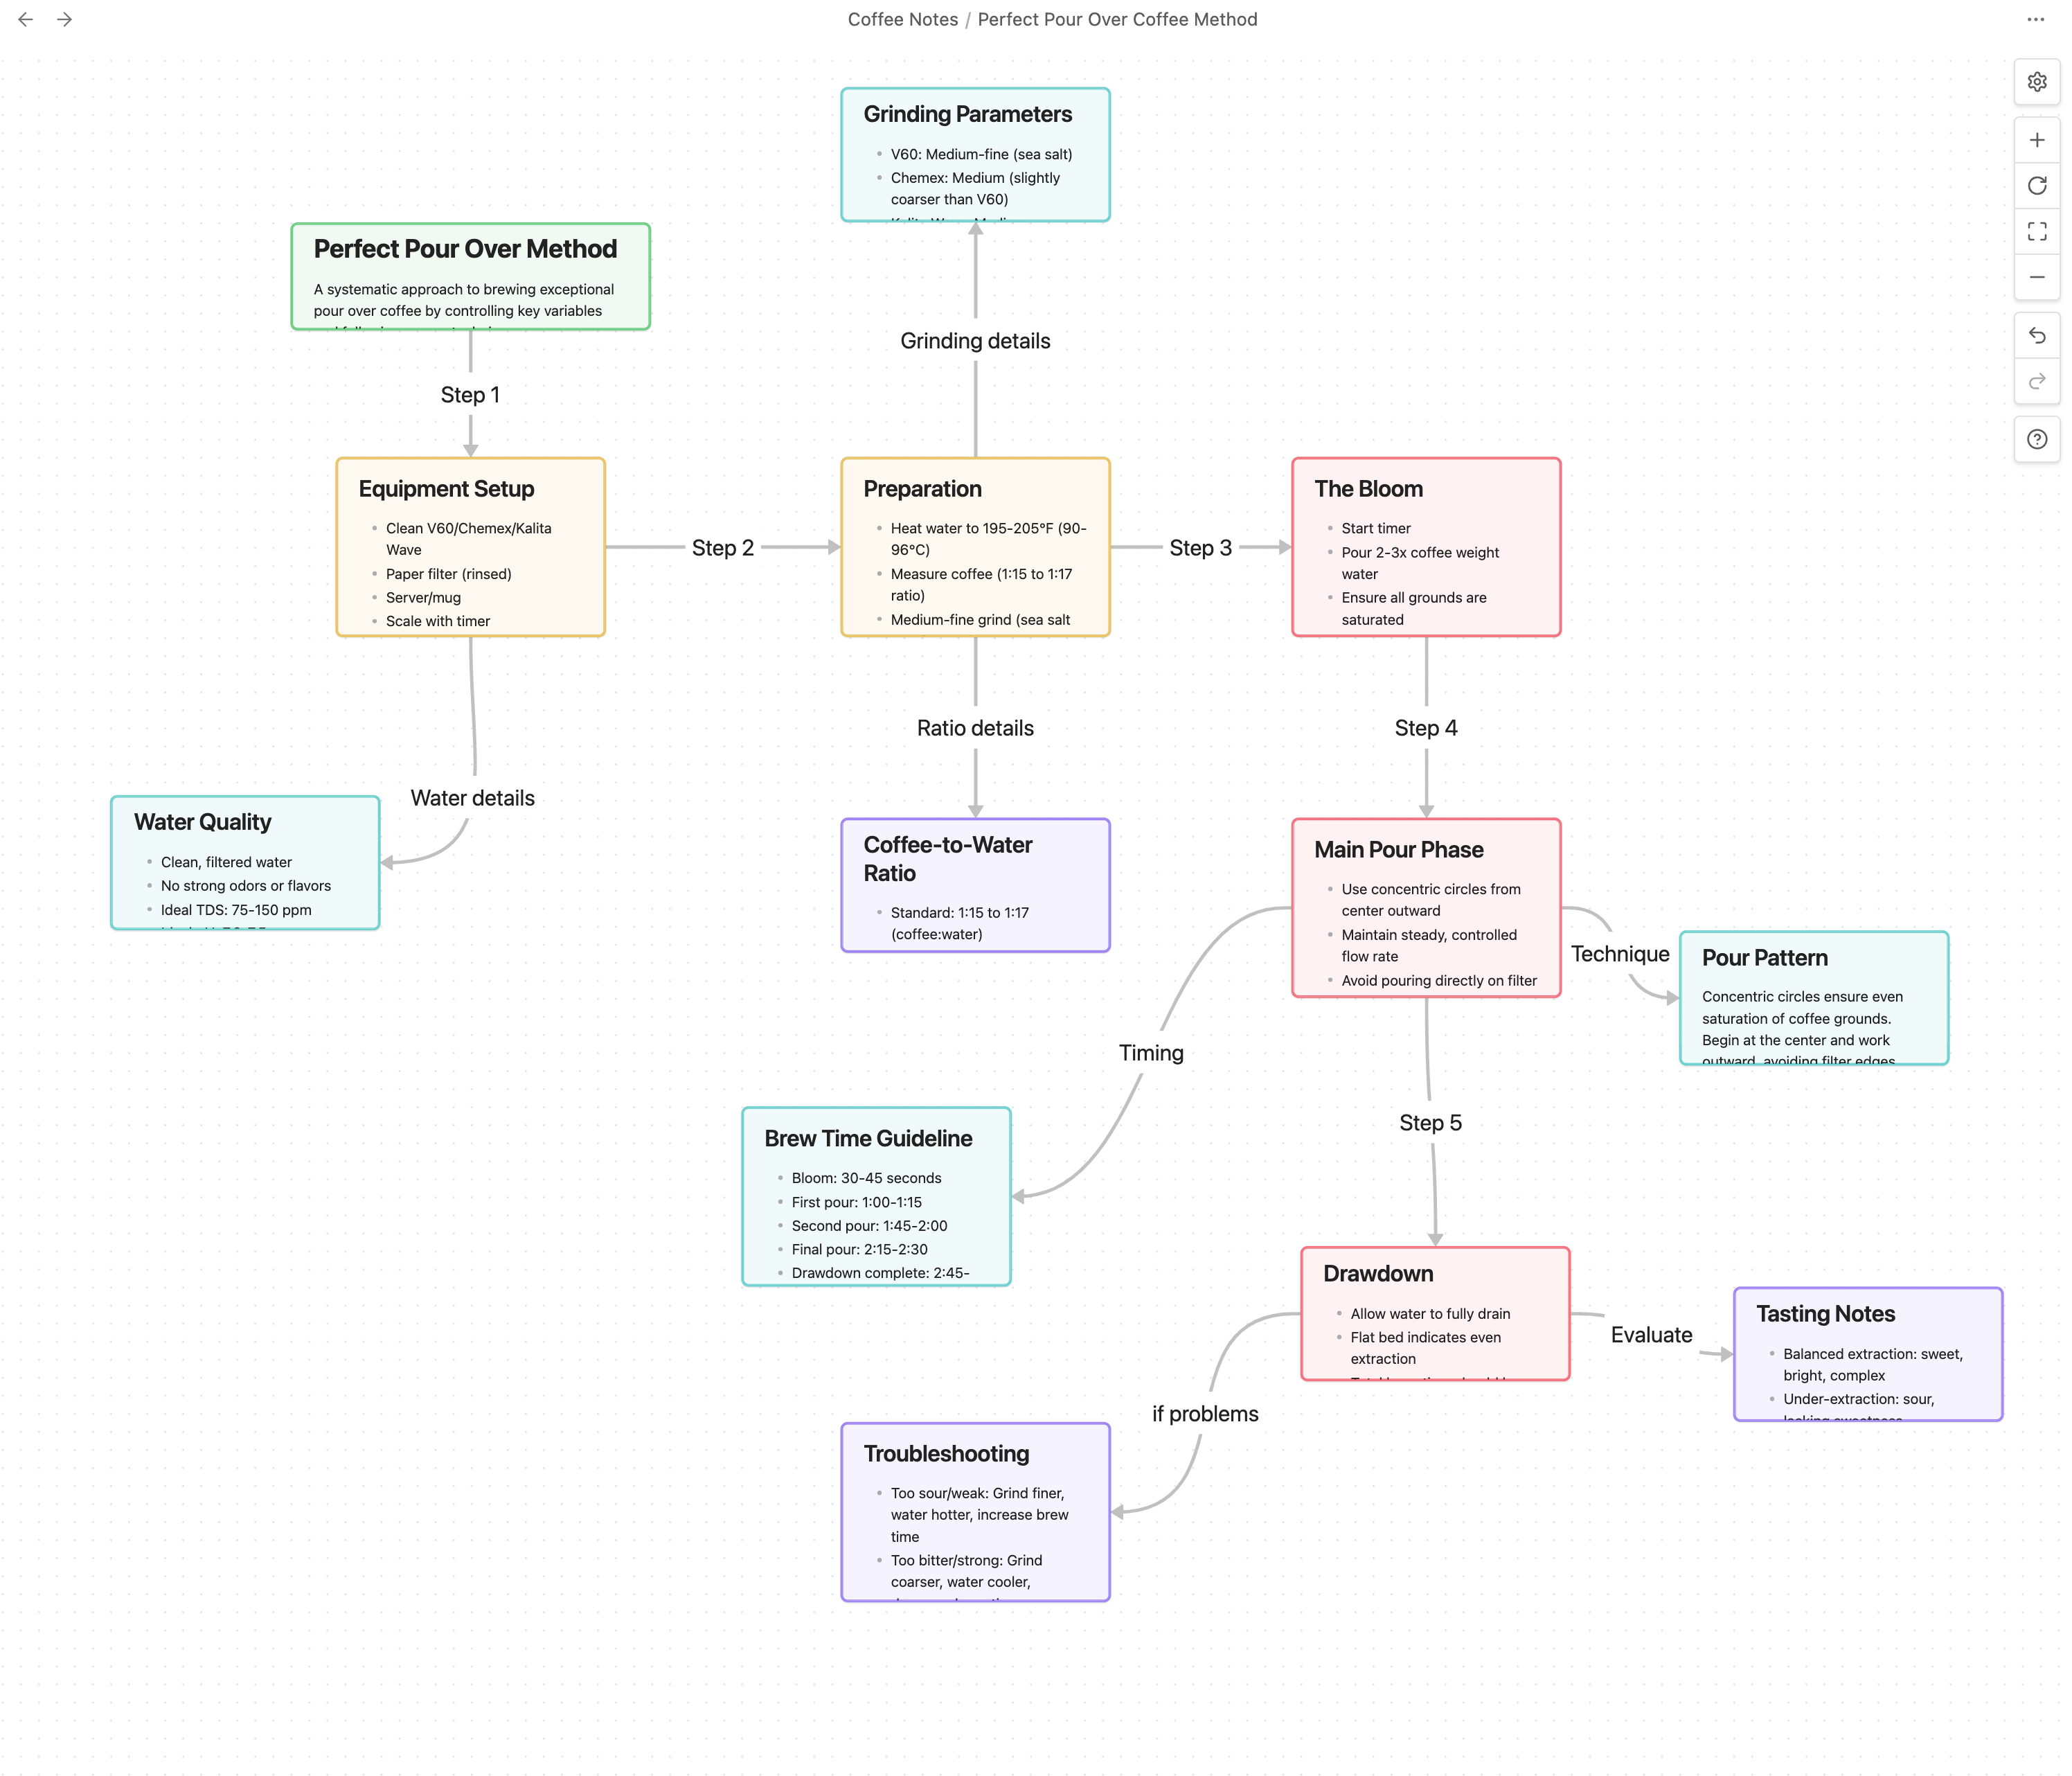
- Example Requests — - "Create a canvas visualization of my project components and their relationships." - "Make a concept map showing the main themes from our discussion about climate change." - "Can you make a canvas diagram of the perfect pour over method?"
Types of Visualizations
Basic Memory can create several types of visual maps:
- Document Maps — Visualize connections between your notes and documents
- Concept Maps — Create visual representations of ideas and their relationships
- Process Diagrams — Map workflows, sequences, and procedures
- Thematic Analysis — Organize ideas around central themes
Relationship Networks
Show how different entities relate to each other in your knowledge base.
Visualization Sources
Claude can create visualizations based on:
Documents in Your Knowledge Base
You: "Create a canvas showing the connections between my project planning documents"
Conversation Content
You: "Make a canvas visualization of the main points we just discussed"
Search Results
You: "Find all my notes about psychology and create a visual map of the concepts"
Themes and Relationships
You: "Create a visual map showing how different philosophical schools relate to each other"
Visualization Workflow
Request a visualization
Describe what you want to see by asking Claude to create a canvas
Claude creates the canvas file
The canvas file is automatically created in your Basic Memory directory
Open the file in Obsidian
View the visualization in Obsidian's Canvas feature
Refine the visualization
Ask Claude for adjustments:
- "Could you reorganize the canvas to group related components together?"
- "Please add more detail about the connection between these two concepts."
Technical Details
Behind the scenes, the AI:
- Creates a
.canvasfile in JSON format - Adds nodes for each concept or document
- Creates edges to represent relationships
- Sets positions for visual clarity
- Includes any relevant metadata
The resulting file is fully compatible with Obsidian's Canvas feature and can be edited directly in Obsidian.
Tips for Effective Visualizations
- Be Specific — Clearly describe what you want to visualize
- Specify Detail Level — Mention how much detail you need
- Mention Type — Specify the visualization type (concept map, process flow, etc.)
- Start Simple — Begin with basic visualizations and ask for refinements